Getting started with OpenTelemetry
The Checkly OpenTelemetry (OTel) integration allows you to correlate synthetic monitoring checks with traces from your backend services. This integration is especially useful for two types of users:
- Resolve issues quicker: Resolve failing synthetic checks much quicker by correlating failing checks with backend & infrastructure traces. No more flipping between various 3rd party observability (o11y) systems.
- Increase signal vs. noise: Cut through the sea of o11y and focus on the data that correlates to critical and known business processes as exercised by synthetic monitoring checks.
- Save money: Send traces directly to Checkly, without signing up for another product or hosting an OTel solution yourself.
With OpenTelemetry enabled, you will have access to traces in all the places where it matters to more quickly resolve issues:
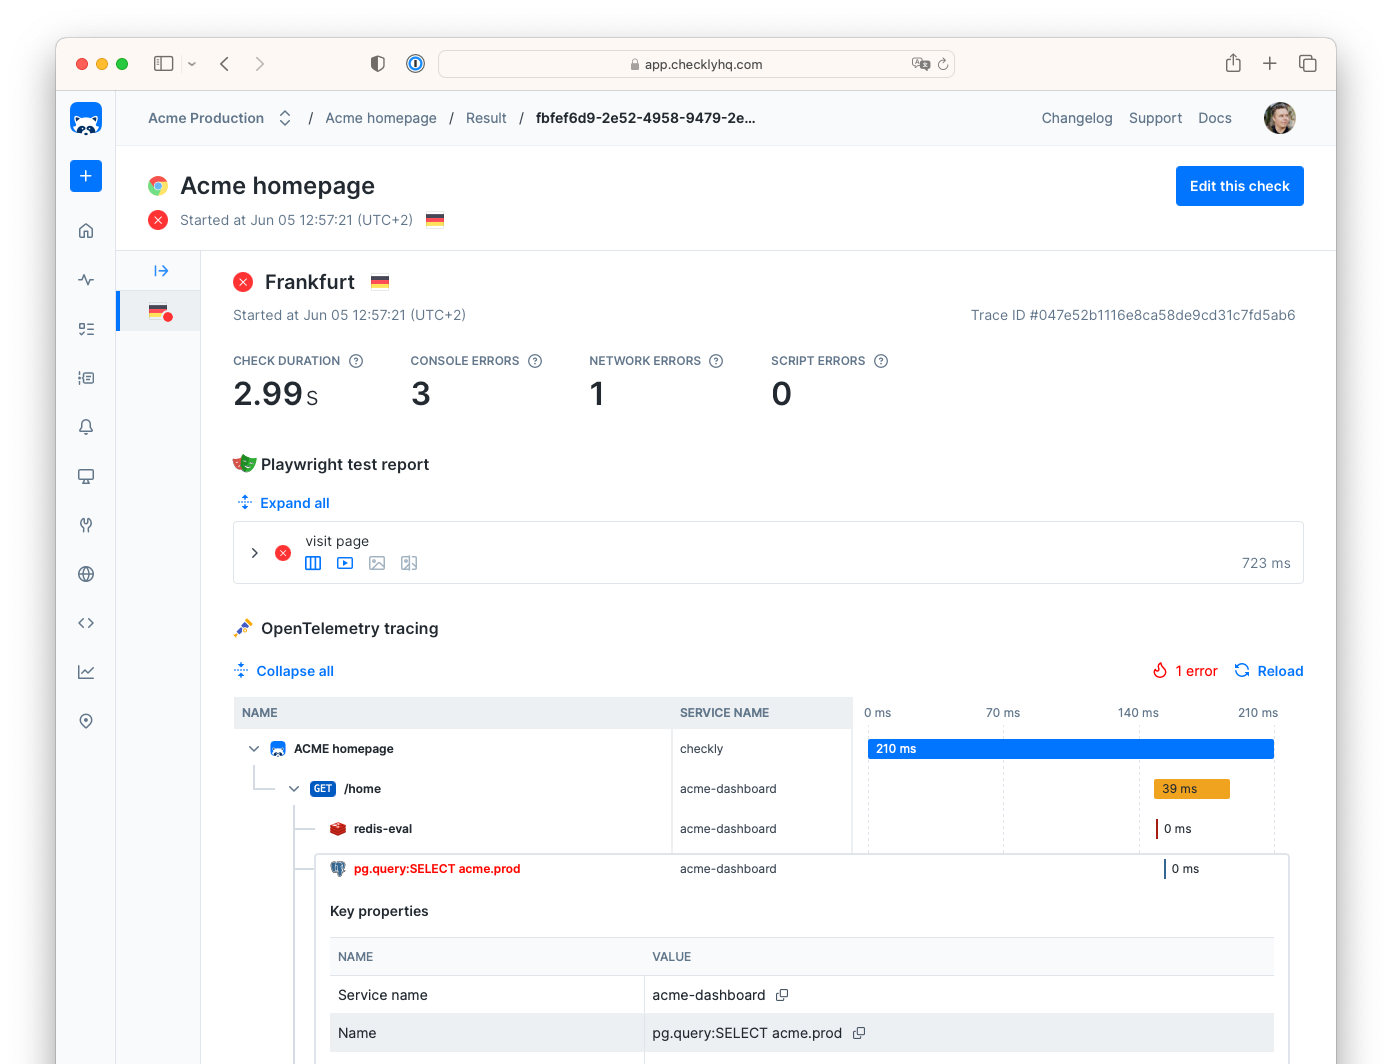
- Check results: resolve production outages faster by correlating failing checks with backend traces.
- Test sessions: understand any failures during test session execution.
- Check Editors get a live trace while building, editing and debugging check code.
See this in action in the video below:
To get started with the Checkly OpenTelemetry integration, pick a scenario that best fits your needs.
 I don't have an OpenTelemetry setup
Instrument your app and send traces directly to Checkly. No need for a 3rd party OTel backend.
 I have an OpenTelemetry setup
Send traces to your 3rd party OTel backend and ingest them into Checkly too.
If you want to learn more about how this all works, check out the How it works under the hood section.
Last updated on June 7, 2024. You can contribute to this documentation by editing this page on Github